Basics of Performance Calculations
Performance Intervals in BridgeFT Reports
As we mentioned in the previous Reporting APIs Guide about “the standard performance intervals” (PTD, MTD, QTD, YTD, ITD, ITD Annualized, Three Year, Five Year, LTM), below is an additional explanation about what these intervals are:
-
PTD (
ptd_return) - The performance return for the requested period to date, on the real scale. -
MTD (
mtd_return) - The performance return for the month to date, on the real scale. Period begins as of the prior month close / current month open. -
QTD (
qtd_return) - The performance return for the quarter to date, on the real scale. Period begins as of the prior quarter close / current quarter open. -
YTD (
ytd_return) - The performance return for the year to date, on the real scale. Period begins as of the prior year close / current year open. -
ITD (
itd_return) - The performance return from the entity inception to date. BridgeFT treats an account's Inception Date as the first date for which we have stored data. This may differ from the date BridgeFT started collecting transaction history if we have history from a conversion or other sources. A household's Inception Date corresponds to the oldest inception date from its constituent accounts. The Inception to Date Return formula:
gain = ending_period_value - beginning_period_value - cash_flow + outside_income
base = beginning_period_value + weighted_cash_flow
period_return = gain/base
This provides the period_return for a day, and would include all days for ITD with this formula below:
((return_day_1 + 1) * (return_day_2 + 1) * (return_day_2 + 1) ... * (return_today +1 )) - 1
- ITD Annualized (
itd_annual_return) - if we have more than a year’s worth of data, we provide the annualized ITD return which we obtain with the following formula:
itd_annual_return = (1 + itd_return ^365/days of data) - 1
-
3YR (
three_yr_return), 5YR (five_yr_return) - Period begins 3 or 5 years prior report date. Each of these period's return number is annualized, not cumulative. When looking at the these return numbers, note that values, like other date intervals above, will change based on the report date. For example: a report run as of Jan. '18 vs. Jan. '19. For Jan. '18, the 3 year annualized return will take the account return from Jan. '15 through Jan '18 and annualize the return. The 3 year annualized return for Jan. '19 will take the account return from '16 to '19. -
12 Months (
ltm_return) - The annualized performance return for the twelve-month period to day.
Performance Calculation Methodology
There are few different performance calculation methodologies are commonly used in the market:
- Simple Rate of Return
- Time Weighted Return (TWR)
- Internal Rate of Return (IRR)
The key difference among these approaches is how cash flows are treated. If there are no cash flows in an account, all three methods will produce the same return calculation. Of course, it is unlikely that a cash flow would not occur, and it would be misleading and incorrect to not account for this.
That is why BridgeFT uses the Time-Weighted Return (TWR) methodology which is recommended by the Global Investment Performance Standards (GIPS) set forth by the CFA Institute. With this approach, the effects of cash flows are eliminated so that one can evaluate the performance of an investment strategy. This approach allows for the most “apples to apples” comparison against things like benchmarks as it isolates the return generated by the advisor’s decisions. Regardless of how large or small an account is or how much money it has, returns calculated with this approach can be accurately compared.
Note: Performance returns are calculated net of fees, meaning all applicable fees have been deducted from the return figures prior to reporting. This approach provides a more accurate representation of the investor’s realized performance and aligns with established best practices for performance reporting.
The idea behind the TWR is that when there is a cash flow, the portfolio is valued on that day to create sub-periods. Returns are calculated for each sub-period and then geometrically linked to calculate a return for the whole period. For example, if a cash flow happens on June 15th, a sub-period return is calculated for the periods of June 1-14 and June 15-30.
The generalized formula looks like this:

where:
- r1 = return for the first sub period
- r2 = return for the second sub period
- rn = return for the final sub period
The return itself is calculated using the following formula:
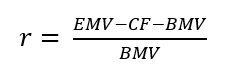
where:
- EMV = ending market value
- BMV = beginning market value
- CF = cash flow
In older systems, it was considered too timely or computationally difficult to calculate a sub-period for each and every cash flow. A percentage threshold would be set where only if a cash flow is greater than 10% of the BMV, for example, a sub-period is created.
BridgeFT does not require this input because it calculates daily returns and geometrically links those. We are able to do this because we store daily prices, transactions, and positions information and maintain a daily records of balances.
Calculation Example
Note some key assumptions:
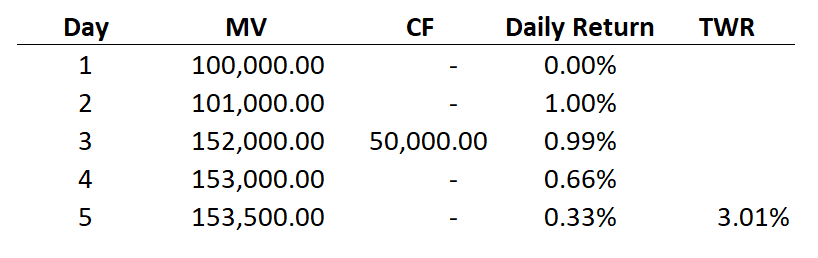
- Income and dividend accrual dates are not currently available for performance calculations. Accrued dividends and income are only included in the market value of positions beginning on the pay out date.
- Cash flows are assumed to be beginning of day.
- Cash flows include both cash and security transfers. Security transfers are calculated using end of day prices on the date of the transfer.
- When you select a date range, the balance that is included in the calculation is the balance at the end of the day. For example, if you generate a custom report with the date range 1/1/19 - 6/30/19, the return on the day of 1/1 will not be included because the beginning market value is the closing balance on 1/1. For a year to date report, you would need to select 12/31/18 so that the daily return on 1/1 is included.
Why TWR methodology?
BridgeFT uses the TWR methodology for the following reasons:
-
Highest standards available for performance numbers.
-
Robust methodology for benchmarks designed to make them as closely aligned to the returns of your client accounts (enabling apples-to-apples comparisons) in addition to normalizing away any idiosyncrasies of benchmark components (e.g. an index like the CPI that only reports once per month). The return numbers use identical calculation methodology to the benchmark and account, household returns.
-
Improved transparency and context around account or household returns for you and your client conversations.
-
The performance returns calculations have been designed to align with GIPS performance calculation methodology, widely regarded as the highest standard of calculation methodology maintained by the CFA Institute.
Updated 4 months ago