Reporting Engine APIs Guide
In this guide, we explain the capabilities of BridgeFT’s Reporting Engine APIs: the different ways they can be used, examples of requests and flows, as well as an overview of the reports we offer and details about the calculation methodology used for portfolio performance reports.
BridgeFT offers two approaches to building reports in your application:
-
Use our Printable Report API, which allows you to generate and download pre-built PDF reports. Alternatively:
-
Get the Reporting Data Only – utilize our Web Report API, which enables you to retrieve the data payload in JSON format to build your PDF reports. This provides you with the flexibility to design and construct reports in the exact way that best suits your needs, while still saving you the heavy lifting of assembling the underlying data and making performance calculations.
Follow the next steps to implement the best option for your use case.
Use Case #1. Utilizing Printable Reports API
If your application doesn’t support building PDF files but your users require a printable version of the performance reports, you can utilize our pre-built PDF reports. In this type of invocation, the report is generated and rendered by an asynchronous backend service.
After the report is successfully generated using an endpoint for creating the printable report (POST https://api.bridgeft.com/v2/reporting/printable-reports/create - Start a PDFReport Job, you can interact with it using all the usual RESTful operations, such as:
-
List all reports:
GET https://api.bridgeft.com/v2/reporting/printable-reports- List all Printable Reports -
Retrieve a single report:
GET https://api.bridgeft.com/v2/reporting/printable-reports/{id}- Retrieve a Printable Report -
Delete a single report:
DELETE https://api.bridgeft.com/v2/reporting/printable-reports/{id}- Delete a Printable Report -
Filter reports:
POST https://api.bridgeft.com/v2/reporting/printable-reports/filter- Filter all Printable Reports -
Delete many reports:
POST https://api.bridgeft.com/v2/reporting/printable-reports/delete-many- Delete many Printable Reports
Additionally, there are specialized endpoints for downloading the actual PDF contents:
-
Retrieve a report’s printable download stream:
POST https://api.bridgeft.com/v2/reporting/printable-reports/download/{id}- Retrieve a Printable download stream -
Bulk download many reports:
POST https://api.bridgeft.com/v2/reporting/printable-reports/download- Bulk Download Printable PDFs
Step-by-Step Requests Sequence
To build and retrieve printable reports, you will need to use several of these endpoints in sequence. Follow the below sequence of requests:
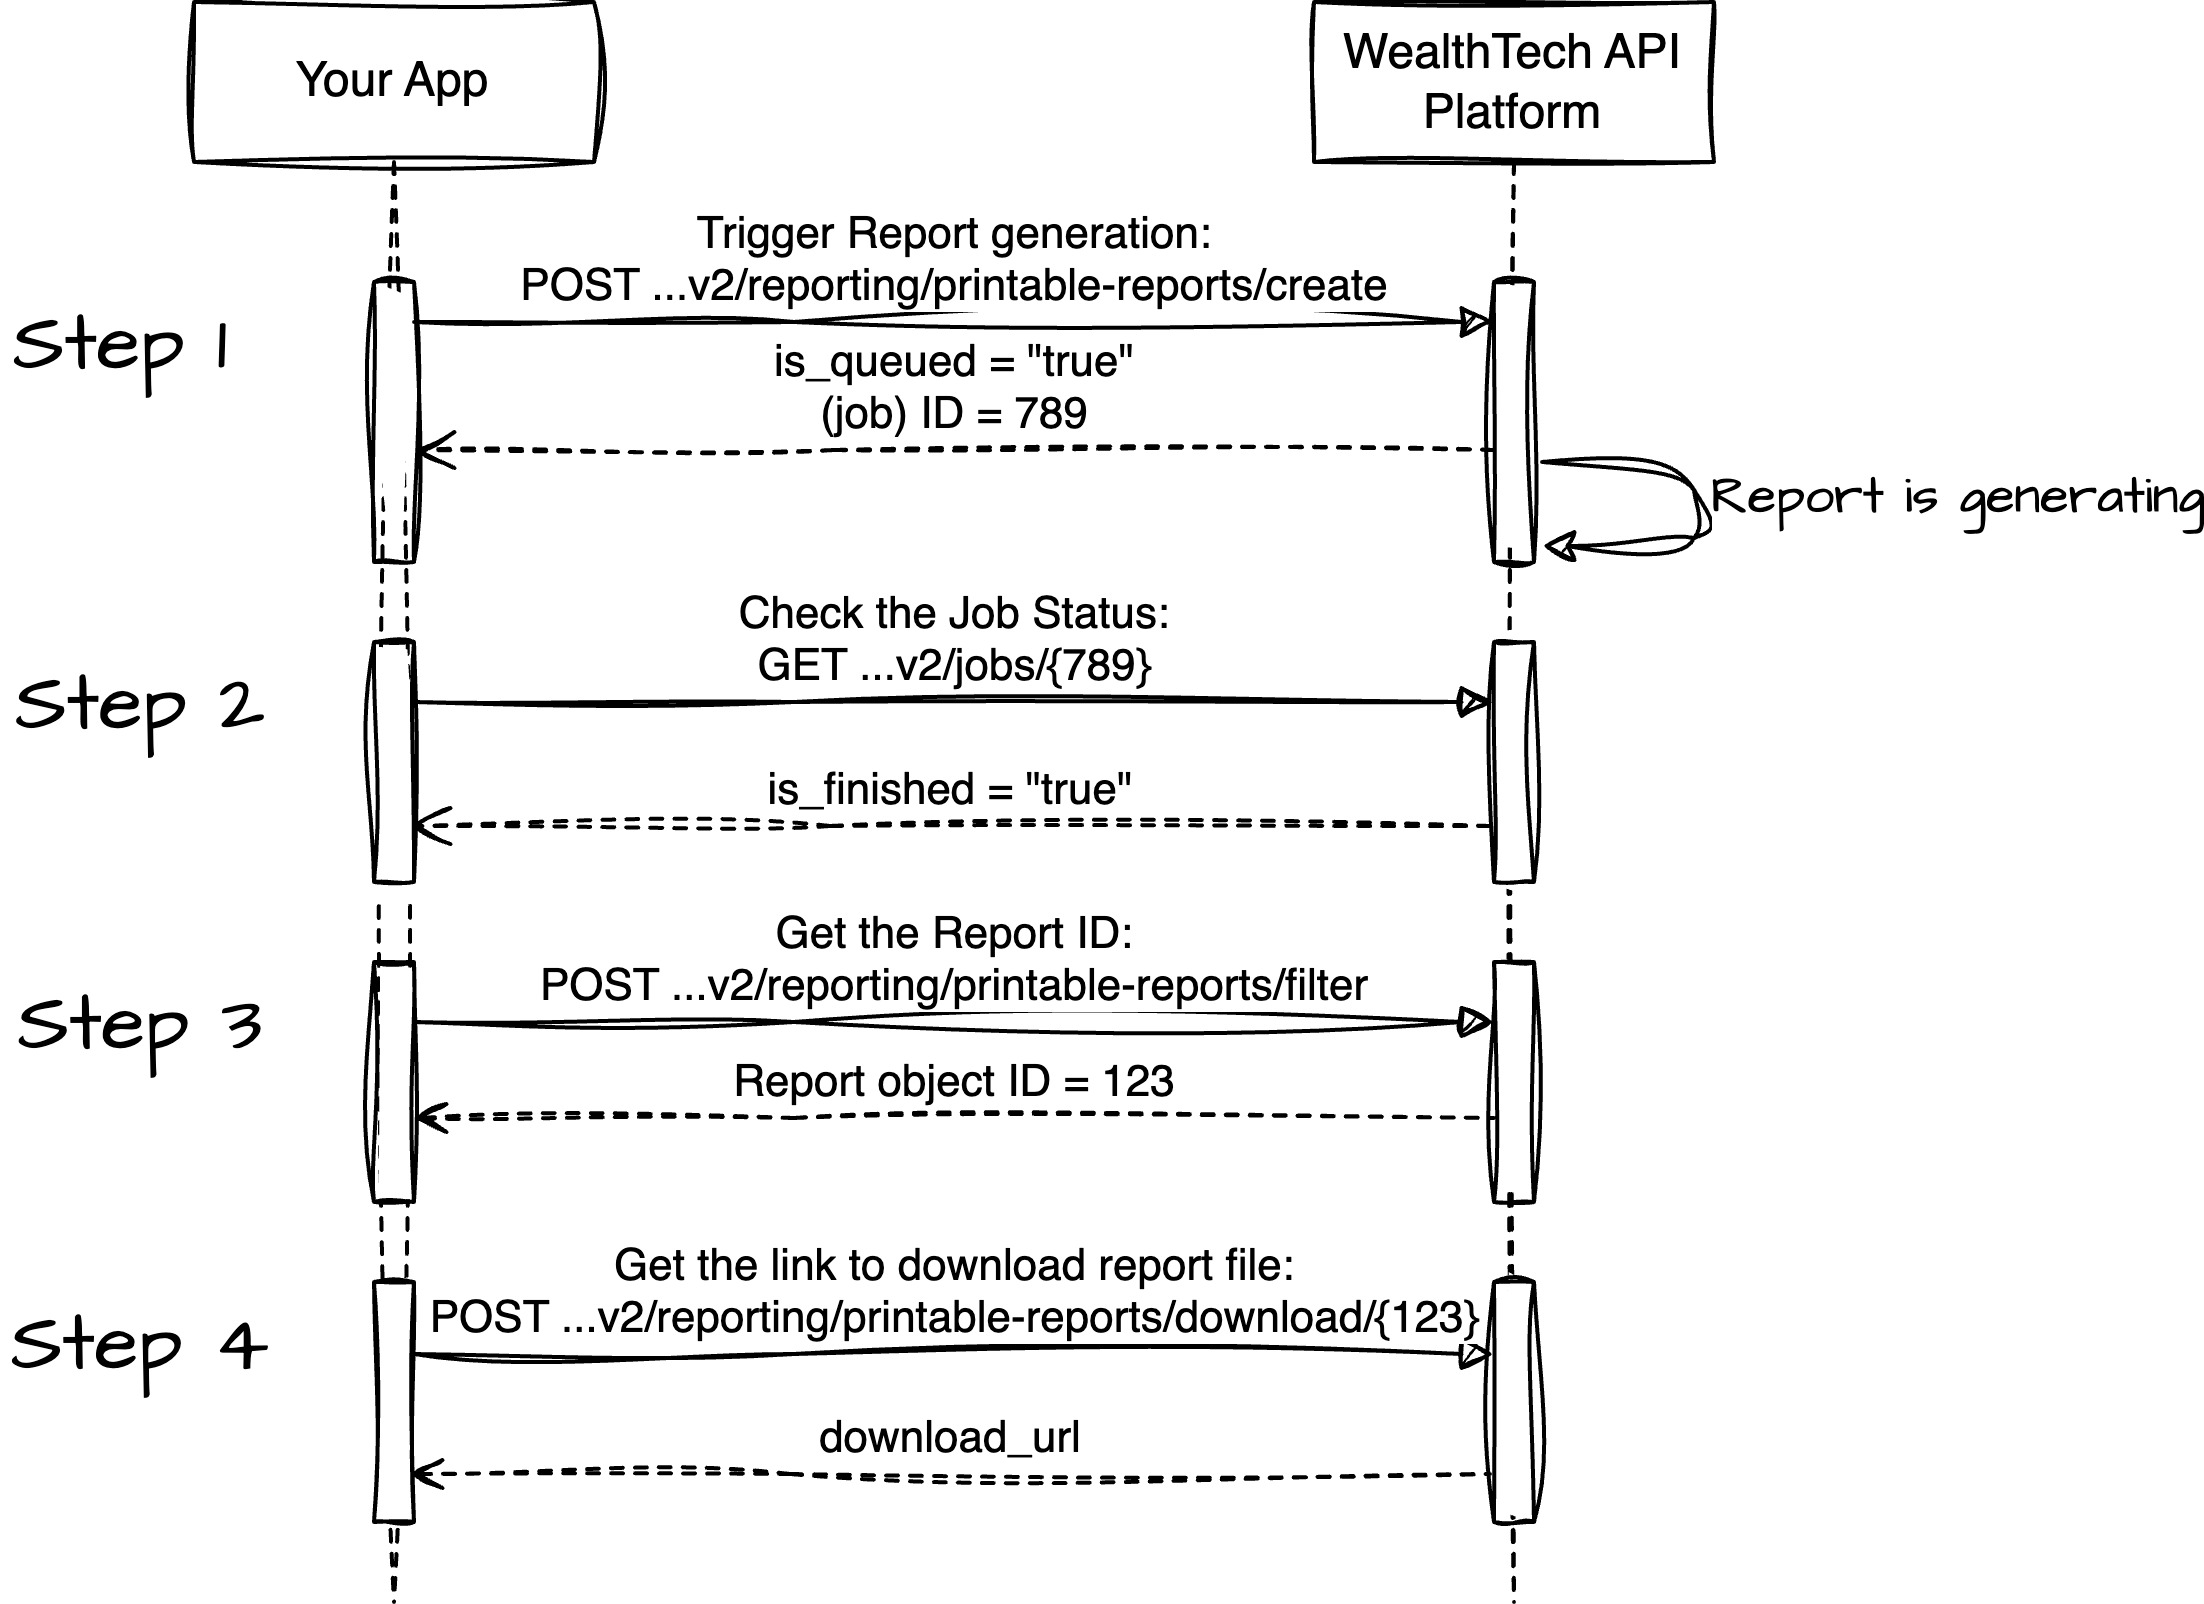
Step 1. Trigger the Reports Job which will perform all required data calculations and the PDF file generation on the BridgeFT’s side:
curl --request POST 'https://api.bridgeft.com/v2/reporting/printable-reports/create' \
     --header 'accept: application/json' \
     --header 'authorization: Bearer {YOUR_TOKEN}' \
     --header 'content-type: application/json' \
     --data '
{
  "sub_reports": [
    "account_summary"
  ],
  "start_date": "2023-01-01",
  "end_date": "2023-12-31",
  "account_id": 456
}
'
Step 2. Check the report generation status with the job_id returned from Step 1:
curl --request GET 'https://api.bridgeft.com/v2/jobs/{JOB_ID}' \
     --header 'accept: application/json' \
     --header 'authorization: Bearer {YOUR_TOKEN}' \
     --header 'content-type: application/json'
Step 3. Once Report Job is completed, get the report_id using Printable Reports API:
curl --request POST 'https://api.bridgeft.com/v2/reporting/printable-reports/filter' \
     --header 'accept: application/json' \
     --header 'authorization: Bearer {YOUR_TOKEN}' \
     --header 'content-type: application/json' \
     --data '
{
  "state": "R",
  "report_date": "2023-12-31",
  "account_id": 456
}
'
Step 4. Now, use the report_id returned on the previous step to download the PDF report file:
curl --request GET 'https://api.bridgeft.com/v2/reporting/printable-reports/{REPORT_ID}' \
     --header 'accept: application/json' \
     --header 'authorization: Bearer {YOUR_TOKEN}'
This request will return you the link to download the generated report file. This PDF file is properly formatted and ready to be shared with your clients.
Use Case #2. Using Web Reports API (Data Only approach)
To retrieve data for constructing reports on your end, simply send a POST request to the Web Reports API. In this type of invocation, the report data payload is generated synchronously and returned directly to the user with just one request. This type of report is entirely ephemeral – no data is saved at any time, so the usual RESTful operations (get one, list many, delete, etc.) are not applicable here.
Request example:
curl --request POST 'https://api.bridgeft.com/v2/reporting/web-reports' \
     --header 'authorization: Bearer {YOUR_TOKEN}' \
     --header 'content-type: application/json' \
     --data '
{
  "sub_reports": [
    "account_summary"
  ],
  "start": "2023-07-01",
  "end": "2023-12-31",
  "account_id": 1234,
  "firm_id": 22
}
'
This request will return performance report data calculated using the TWR method for account 1234 for the period from July 1st, 2023, to December 31st, 2023.
The response from this endpoint includes a large and complex data payload containing all the structures needed for the requested sub reports. You can find the full response schema in our documentation under the 200 section of RESPONSES here: Run a web report.
Input Parameters Overview
Whether you are using Printable Reports API (POST https://api.bridgeft.com/v2/reporting/printable-reports/create) or Web Reports API (POST https://api.bridgeft.com/v2/reporting/web-reports), there are certain mandatory parameters required for the Reporting Engine to build your report. They are as follows:
start- the start date of the reporting period in YYYYMMDD format.end- the end date of the reporting period in YYYYMMDD format.account_idORhousehold_id- either the account IDs OR household IDs for which the report data will be generated. You can retrieve account or household IDs using Accounts (List all Accounts) and Households (List all Households) APIs respectively.firm_id- FOR WEB REPORTS API ONLY: the firm to which the account or household belongs. This ID can be retrieved using the Firms API (Filter all Firms) where you can search for the firm linked to your application.sub_reports- a comma-separated list of sub-reports which you want the Reporting Engine to build for you. You can find more about the available sub-reports in the next section of this guide. For example:
{"sub_reports": ["account_summary", "performance_summary", "appraisals"]}In addition to these mandatory input parameters, there are also a few optional ones:
irr_performance- specifytrueif you want to use Internal Rate of Return (IRR) for performance calculations. If you specifyfalseor omit the parameter entirely, it will default to Time Weighted Return (TWR) for performance calculations. You can find more information about Performance Calculation Methodology below in this guide.portrait_pdf_orientation- FOR PRINTABLE REPORTS API ONLY: specifytrueif you want PDFs to be generated in portrait orientation. If you specifyfalseor omit the parameter entirely, it will default to landscape orientation.non_inception_performance_chart- FOR PRINTABLE REPORTS API ONLY: specifytrueif you want the performance chart to be Period to Date (PTD). If you specifyfalseor omit the parameter entirely, it will default to Inception to Date (ITD).
Sub-Reports Explained
We offer a comprehensive selection of sub-reports that users can choose from through our Reporting Engine. When creating a report (via Printable Reports API or Web Reports API), you must provide at least 1 and up to all 20 sub-reports in your request. In the case of creating a printable report, the order in which you request the sub-reports will determine the order they are rendered in the PDF document.
Note for Web Reports API OnlySub-reports are also utilized to organize the data in the response payload from the Start Web Reports endpoint. These may not always directly correspond one-to-one with the input. For instance, while
net_investment_chartcan be input in your request to create a web report, the corresponding data for this sub-report is located under theaccount_summary(orhousehold_summaryif a household id was provided in the request) section of the response payload. For this reason, we outline where the output can be found in the JSON response in the list below.
Below is a list of all available sub-reports:
account_summary- this report details the performance returns for the selected account along with any assigned benchmarks or indexes, for fixed intervals as of the report date. If benchmarks or indexes are not used, the report will include only the data for the selected account.
A simple table contains beginning and ending value, net contributions, income, and net appreciation for both Inception to Date (ITD) and Period to Date (PTD).
Note thataccount_summaryalso works for households, but the output may differ in this case.
{
  "input": ...
  "entity_info": ...
  "sub_report_data": {
    "account_summary": {
      "inception":
      "period":
    }
    OR
    "household_summary": {
      "inception":
      "period":
    }
  }
}allocation_and_performance_summary- a composite report that combines elements from the account_summary report with asset allocation and performance data. Designed to be rendered in portrait orientation.
{
  "input": ...
  "entity_info": ...
  "sub_report_data": {
    "allocation_and_performance_summary":
  }
}appraisals- This report provides a snapshot of the account on a given day, alternatively referred to as an "Unrealized Gains and Losses" report. It allows assessment of portfolio valuation and other metrics by security, at a total holding or individual tax lot level. This report is particularly useful for clients interested in implementing tax-efficient investing strategies.
The report summarizes the holdings of an account or household. The data include security description, quantity, current price, current market value, cost basis and unrealized gain loss and are offered both grouped by classification and ungrouped. Only securities held on as of the latest report end date or the latest available market date when the report end date is in the future will be available.
{
  "input": ...
  "entity_info": ...
  "sub_report_data": {
    "appraisal":
  }
}appraisals_wo_cost_basis- the same as appraisals but without cost basis or unrealized gain loss info.
{
  "input": ...
  "entity_info": ...
  "sub_report_data": {
    "appraisal":
  }
}asset_allocation_top_holdings- this report displays the top ten latest holdings in the account’s portfolio, broken down by asset classes allocation based on system defaults or Custom Asset Classifications. It is useful for demonstrating investment strategy and top holdings to clients.
{
  "input": ...
  "entity_info": ...
  "sub_report_data": {
    "top_holding":
  }
}benchmark_performance_summary- a simple table with the standard performance intervals (PTD, MTD, QTD, YTD, ITD, ITD Annualized, Three Year, Five Year, LTM) for each benchmark associated with the account/household.
{
  "input": ...
  "entity_info": ...
  "sub_report_data": {
    "account_summary": {
      "benchmark_performance":
    }
    OR
    "household_summary": {
      "benchmark_performance":
    }
  }
}buy_sells- this report details all buys and sells that have occurred within an account or across all accounts in a household in the report period.
{
  "input": ...
  "entity_info": ...
  "sub_report_data": {
    "buysell":
  }
}consolidated_summary- combines account/household performance and benchmark performance on the same table.
{
  "input": ...
  "entity_info": ...
  "sub_report_data": {
    "account_summary": {
      "latest_performance":
      "benchmark_performance":
    }
    OR
    "household_summary": {
      "latest_performance":
      "benchmark_performance":
    }
  }
}deposits_withdrawals- this report details cash deposits and withdrawals within an account or across all accounts in a household, including both cash and security transfers in the report period.
{
  "input": ...
  "entity_info": ...
  "sub_report_data": {
    "deposit_withdrawal":
  }
}household_performance_attribution- an account-level breakdown of summary and performance data to provide extra granularity when running a household report.
{
  "input": ...
  "entity_info": ...
  "sub_report_data": {
    "household_summary": {
      "account_summaries":
      "account_performance":
    }
  }
}income- this report provides details about all income and expense transactions for the account or household in the reporting period.
{
  "input": ...
  "entity_info": ...
  "sub_report_data": {
    "income_expense":
  }
}management_fees- this report outlines management fees assessed from client account(s) or households, consolidating fees to a single report for a given time period to address client inquiries about charges.
{
  "input": ...
  "entity_info": ...
  "sub_report_data": {
    "management_fee":
  }
} net_investment_chart- a chart that plots cumulative net contributions and portfolio value together.
{
  "input": ...
  "entity_info": ...
  "sub_report_data": {
    "account_summary": {
      "monthly_itd_chart": {
        "balance":
        "cumulative_contribution":
      }
    }
    OR
    "household_summary": {
      "monthly_itd_chart": {
        "balance":
        "cumulative_contribution":
      }
    }
  }
}performance_summary- a simple table with the standard performance intervals (PTD, MTD, QTD, YTD, ITD, ITD Annualized, Three Year, Five Year, LTM) in a monthly time series.
{
  "input": ...
  "entity_info": ...
  "sub_report_data": {
    "account_summary": {
      "performance":
    }
    OR
    "household_summary": {
    "performance":}
  }
}performance_chart- a chart that plots the cumulative return of portfolio and benchmarks together.
{
  "input": ...
  "entity_info": ...
  "sub_report_data": {
    "account_summary": {
      "monthly_itd_chart": {
        "inception_return":
        "period_return":
        "benchmark_inception_return":
        "benchmark_period_return":
      }
    }
    OR
    "household_summary": {
      "monthly_itd_chart": {
        "inception_return":
        "period_return":
        "benchmark_inception_return":
        "benchmark_period_return":
      }
    }
  }
}portfolio_snapshot- a four quadrant report that combines the asset allocation, account summary, net investment chart and performance chart sub reports.
{
  "input": ...
  "entity_info": ...
  "sub_report_data": {
    "snapshot":
  }
}realized_gain_loss- this report details securities that have been sold within a portfolio at a tax lot level, providing realized gains and losses in the report period. It is available at either an account or consolidated household level.
{
  "input": ...
  "entity_info": ...
  "sub_report_data": {
    "gainloss":
  }
}risk_return_chart- this report shows average monthly return annualized, standard deviation of monthly returns annualized, and Sharpe Ratio for an account or household and associated benchmarks, assessing risk-adjusted performance.
The report contains a chart and a table compares the performance and volatility of the portfolio and associated benchmarks.
{
  "input": ...
  "entity_info": ...
  "sub_report_data": {
    "risk_return_chart":
  }
}security_performance- this report represents a high-level performance summary of each security in the account’s or household’s portfolio. It provides details about the security as well as its market values, total returns, and estimated annual income.
The report contains a table with the performance and flows (trading activity, transfers, etc.) of securities held in the report period.
{
  "input": ...
  "entity_info": ...
  "sub_report_data": {
    "security_performance":
  }
}target_vs_actual_allocation- this report offers an overview of portfolio allocations by asset classes. It includes information about all asset classes in the portfolio, their respective weights, and the permitted tolerance deviations within the strategy. The tolerance level represents the allowance for over or underweighting of each asset class relative to its target weight.
The reports contains two pie charts, one showing the target asset allocation and the other showing the actual asset allocation. There is also a table that displays the drift between the two in numerical terms.
{
  "input": ...
  "entity_info": ...
  "sub_report_data": {
    "drift":
  }
}
This is all about the most important things you need to know about BridgeFT's Reporting Engine APIs and how to use it. In the next document HERE we provide more details about the reporting time intervals and calculation methodology used in Performance Reports.
Updated 11 months ago